The Dia canvas is the window that contains the diagram. All of the user's objects are placed and arranged on the canvas.
Grid lines are similar to the lines on graph paper. They allow the user to easily align objects on the canvas. The grid lines can be temporarily hidden for the current document by selecting ->.
Grid line properties can be modified by selecting ->, which brings up the dialog shown in the figure below.
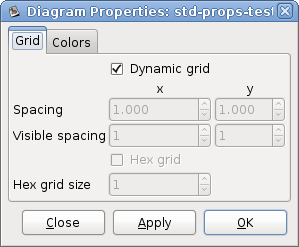
If the Dynamic grid box is checked, the grid adjusts automatically to keep the same visible spacing as the diagram view is zoomed in or out. Also, when this box is checked, the other options on the dialog are disabled.
If the Dynamic grid box is unchecked, then the grid spacing remains the same in absolute terms. So when the view is zoomed out, the grid appears smaller, and when the view is zoomed in, the grid appears larger.
The Spacing for the x and y coordinates is in centimeters and can be typed or entered using the increment / decrement buttons. The visible spacing determines which grid lines are visible. A value of 1 indicates that all grid lines are visible, 2 indicates that every second line is visible, and so on. Note that the snap-to-grid works the same whether or not grid lines are visible.
The Hex grid checkbox allows you to create a grid of hexagons instead of squares. The Hex grid size is also in centimeters.
The snap-to-grid feature may be toggled on and off using the snap-to-grid button located below the canvas. When this is enabled, objects are forced to align on a grid line.
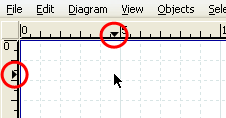
Rulers appear on the top and the left of the Dia canvas. They show, in centimeters, how large your canvas is. A centimeter on the screen will not necessarily equal an actual centimeter. This will depend on your monitor's dots-per-inch (DPI) setting and your current zoom percentage. For example, if your monitor is set to 96 DPI and your zoom percentage is about 185%, then the display ruler is at actual scale. Regardless of these settings, you can always see how big your objects and diagram are using the on-screen ruler.
![[Note]](images/note.png) | Note |
|---|---|
When you print a diagram and select the option Scaling / Scale of 100.0%, the diagram will be printed to scale regardless of the printer's DPI setting or the view zoom factor. |
Each ruler has an arrow that moves along the ruler to show the exact coordinate of the mouse pointer. For example, if the user moves the mouse up, the vertical ruler's arrow will move up, indicating the change. These arrows are useful when an object needs to line up exactly at a certain measurement point.
Rulers can be temporarily hidden for the current document by choosing the menu item ->. Unlike grid lines, rulers cannot be turned off by default for new documents.
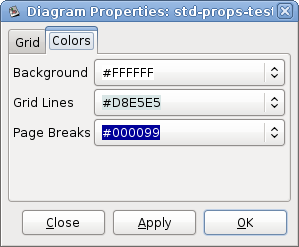
The background color option allows you to change the color of the canvas. By default, the color is white. However, the color can be changed by selecting -> and then selecting the "Colors" tab. The first color option is Background. You can change the color by selecting the drop-down list box and then using the standard color selection options. See Objects / Colors for more information about selecting colors.
| Note |
|---|---|
The gridlines will change their color automatically to stay visible if the background color is changed to black. |
Zooming allows the user to zoom in (make things bigger) or zoom out (make things smaller). Zooming in is useful when you are trying to make your drawing very precise. Zooming out is useful when you want to view a larger portion of the diagram.
The canvas can be zoomed in to 2500% and out to 5%. Zooming can be done in several ways.

The Toolbox contains a Magnify tool. If you select the Magnify tool and then click anywhere on the canvas, the diagram is zoomed in at that point by a factor of two (e.g., from 100% to 200%). Shift+Click reverses the process (i.e., zooms out by a factor of two).
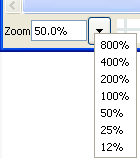
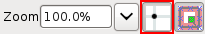
Dia has a zoom control at the lower left corner of the canvas. This control allows you to enter in a zoom percentage or to select from a series of fixed zoom percentages.
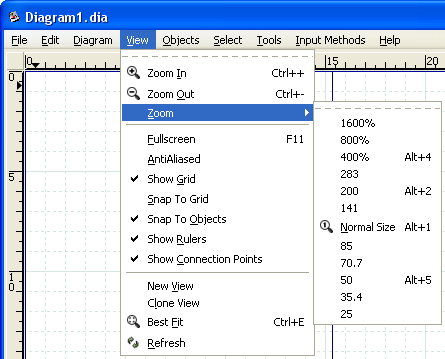
The View menu has options for Zoom In (Ctrl++); Zoom Out (Ctrl+-); Zoom to a choice of fixed percentages; and Best Fit (Ctrl+E).
![[Tip]](images/tip.png) | Tip |
|---|---|
The Ctrl+E (Zoom to Best Fit) is very useful for fitting the entire diagram in the window. It also provides a quick way to see if there are any objects outside the current view area. |
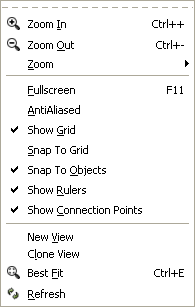
In addition to the zoom options discussed above, the View menu provides a number of useful functions. These are discussed below.
Fullscreen (F11) toggles between the normal window view and full-screen view.
AntiAliased toggles the antialiased feature on and off.
Show Grid toggles the display of the grid on and off.
Snap To Grid toggles the snap-to-grid property on and off.
Snap To Objects toggles the snap-to-objects property on and off. When this is on, lines can be connected to the middle connection point of an object by dragging the line end handle to any point inside the object. When this is off, the line's connection handle must be dragged to the middle connection point of the object being connected.
Show Rulers toggles the ruler display on and off.
Show Connection Points toggles the connection points display on and off.
New View opens a new window that displays the same diagram. This can be useful if you want to see and work on different sections of a diagram at the same time.
Tip If you use New View or Clone View to open a second window on a diagram, changes you make in one window display immediately in the other window. If you open the same diagram file in two different instances of the application (e.g., using File / Open), you must save changes made in one session and re-load the diagram in the second session before they will be visible to the second session. For this reason, using New View or Clone View is normally preferred.
Clone View is the same as New View except that it copies the zoom and size of the first view instead of using the default values.
Best Fit automatically zooms to the highest zoom value that will fit the entire diagram in the window.
Refresh redraws the diagram on the canvas. Normally this is not needed. Occasionally when making changes to a diagram, however, the screen will not redraw correctly. For example, a portion of a deleted line might still display. If this happens, Refresh correctly redraws the canvas.